Overview
A visual model used in economics to illustrate the flow of resources, money, goods, and services within an economy is the circular flow diagram. It draws attention to how various economic actors—mostly households and businesses—are linked as they produce and consume goods and services.
In its simplest form, the circular flow depicts how households supply inputs of production (such labor) to enterprises, and in exchange, receive money (such as wages). A continuous economic cycle is then created when people utilize that revenue to buy products and services from businesses.
Components of the Basic Model
Households
Households serve two primary roles in the economy:
-
As suppliers of resources: Through the factor market, households give businesses labor, land, capital, and entrepreneurial skills.
-
As consumers: Families use their earnings to buy completed goods and services from businesses via the product market.
Households get wages, rent, interest, and profits in exchange for their work and other inputs.
Firms
Firms also have two key responsibilities:
-
As buyers of resources: They hire labor and acquire other factors of production from households in order to produce goods and services.
-
As sellers of products: Firms offer goods and services to households through the product market, generating revenue.
The interaction between firms and households ensures that production and consumption keep the economy flowing.
Markets Involved
Factor Market
The factor market is where firms obtain resources (inputs) from households. These include:
-
Labor (provided by workers)
-
Capital (machines, tools, etc.)
-
Land (natural resources)
-
Entrepreneurship (risk-taking and innovation)
Firms pay households for these inputs in the form of wages, rent, interest, and profits.
Product Market
In the product market, firms sell their finished goods and services to households. The money that households spend here becomes the revenue for firms, which is then used to continue production, pay workers, and reinvest.
Real Flow vs. Money Flow
The circular flow model distinguishes between two types of flows:
-
Real Flow: This refers to the physical movement of resources and goods. For example:
-
Labor flows from households to firms.
-
Goods and services flow from firms to households.
-
-
Money Flow: This represents the financial exchanges in the economy:
-
Firms pay income to households.
-
Households spend income on goods and services.
-
These two flows move in opposite directions but are interconnected.
Expanded Circular Flow
While the two-sector model (households and firms) is the most basic version, more complex models incorporate additional sectors to reflect a real-world economy more accurately.
Government Sector
Both individuals and businesses pay taxes to the government, which then utilizes the money to fund infrastructure and public services. Additionally, it stimulates the economy by means of government expenditures.
Financial Sector
Banks and other financial entities are included in this. A leakage may occur as a result of households setting aside a portion of their income in these institutions. In order to invest, businesses may take out bank loans, which injects money into the market.
Foreign Sector
This sector captures trade with other countries:
-
Imports represent leakages, as money leaves the domestic economy.
-
Exports are injections, bringing in revenue from abroad.
Leakages and Injections
In the expanded model, the economy experiences both leakages and injections:
| Leakages | Injections |
|---|---|
| Savings | Investment |
| Taxes | Government Spending |
| Imports | Exports |
Total leakages must equal total injections in order to keep the economy in balance. Recession, inflation, and other macroeconomic problems may result if they don’t.
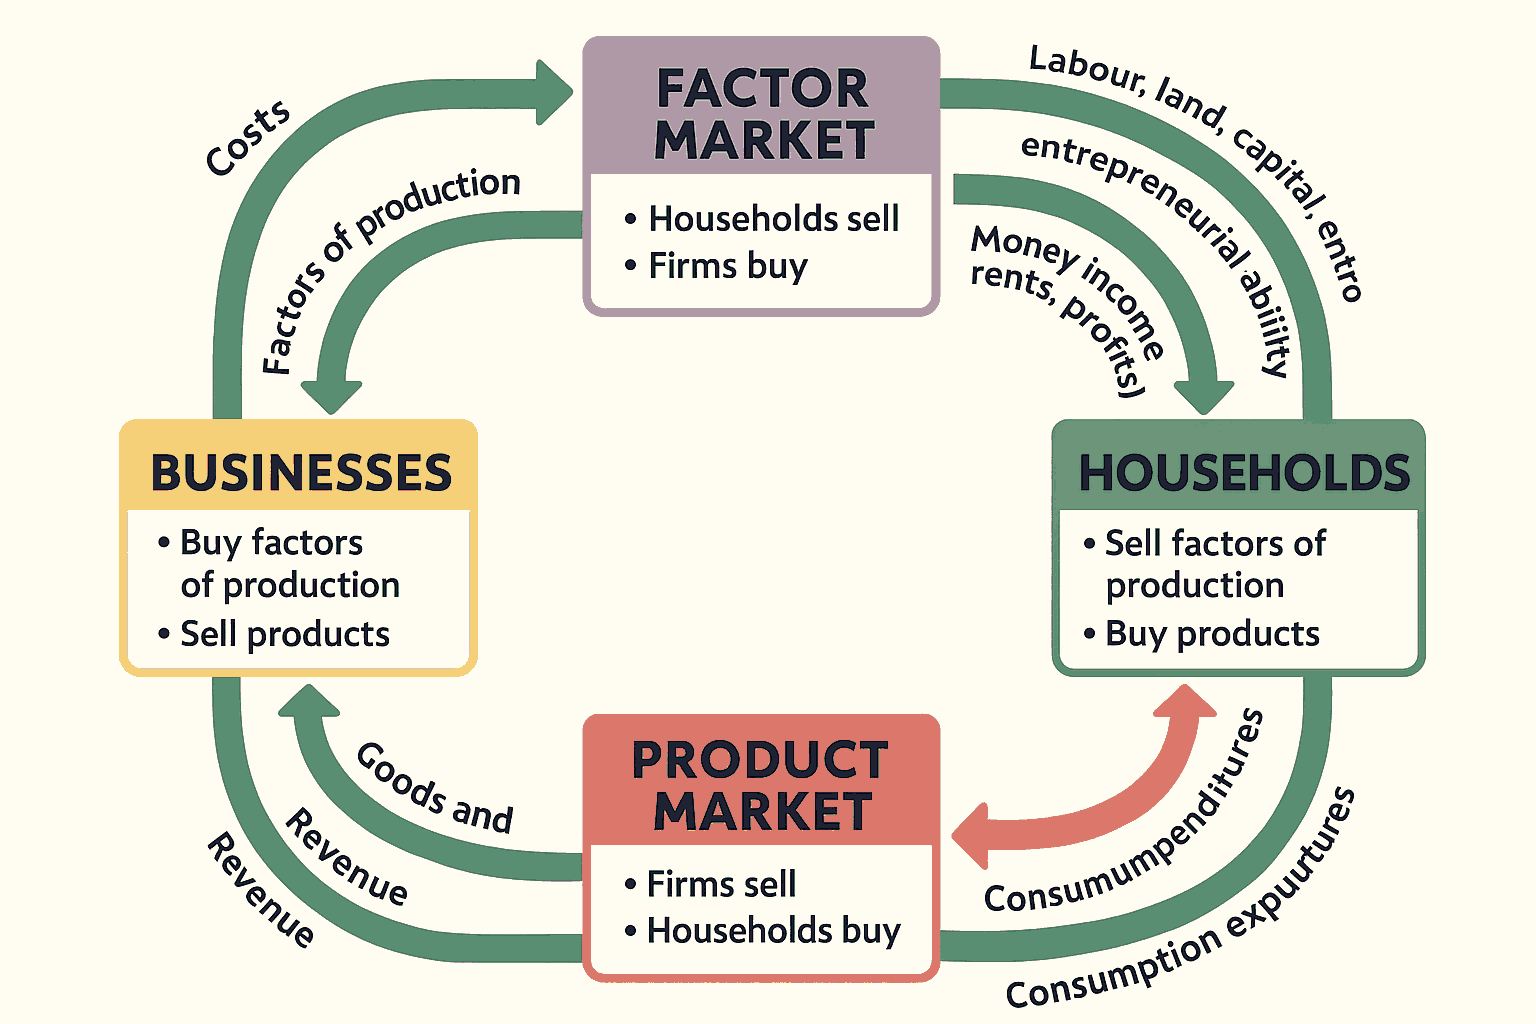
Diagram
Below is a basic illustration of the two-sector circular flow model:
In a full version, this diagram would include government, financial, and foreign sectors as additional loops.
Let me know if you’d like a visual version of the above diagram created specifically for your site.
Lastly
The circular flow diagram simplifies how we understand the movement of money, goods, and resources in an economy. It shows that all parts of the economy are interconnected—households, businesses, governments, and even other countries. By examining this model, economists and students can better grasp how economic activities sustain themselves and how imbalances can affect overall growth and stability.